What Volatility Forecasting Actually Predicts
Volatility, in financial terms, refers to how much and how quickly the price of an asset moves, regardless of direction. A stock that swings dramatically up and down is considered highly volatile, even if it ends up flat over a longer period, while a stock that moves slowly and steadily in one direction is considered lower volatility, even during a strong upward trend.
Volatility forecasting doesn't try to predict whether prices will rise or fall. It tries to predict the expected magnitude of price swings over a specific future period, which is a genuinely different and, in some ways, more tractable problem than predicting direction. This distinction matters because volatility itself tends to be more persistent and patterned than price direction, which is part of why it's a more common target for quantitative forecasting models in the first place.
Why This Matters for Everyday Investors
Volatility forecasts directly influence things that affect everyday investment decisions, even if you never see the forecast itself. Options pricing relies heavily on volatility estimates, since the value of an option depends significantly on how much the underlying asset is expected to move before the option expires. Portfolio risk management tools, including many used in retirement accounts and robo-advisor platforms, use volatility estimates to adjust asset allocation and determine how much of a portfolio should sit in more stable versus more volatile assets.
If you've ever noticed your investment app suggesting a slightly more conservative allocation during a turbulent market period, there's a reasonable chance a volatility forecasting model is part of what's driving that recommendation behind the scenes.
Traditional Approaches Before AI
Before AI-driven approaches became widespread, volatility forecasting relied heavily on statistical models like GARCH (Generalized Autoregressive Conditional Heteroskedasticity), which is a mouthful of a name for a relatively intuitive idea: recent volatility tends to predict near-term future volatility, and volatility itself tends to cluster, meaning calm periods tend to follow calm periods, and turbulent periods tend to follow turbulent ones.
These traditional statistical models remain widely used and are still considered reliable baselines, but they generally rely on a fairly narrow set of historical price data and struggle to incorporate the wide range of other information that might meaningfully affect near-term volatility, like news sentiment, unusual trading volume patterns, or broader macroeconomic signals happening simultaneously across markets.
How AI Approaches the Same Problem Differently
Machine learning models used for volatility forecasting can incorporate a much wider and more varied set of inputs than traditional statistical models, including news sentiment analysis, social media activity, options market data, and cross-asset correlations, all processed simultaneously to identify patterns that might not be obvious from price history alone.
A practical example: an AI model might notice that a specific combination of rising options trading volume, negative news sentiment around a sector, and unusual currency market movement has historically preceded periods of elevated volatility in a related stock, even when the stock's own recent price history looked relatively calm. Traditional statistical models focused purely on historical price patterns would likely miss this kind of cross-market signal entirely.
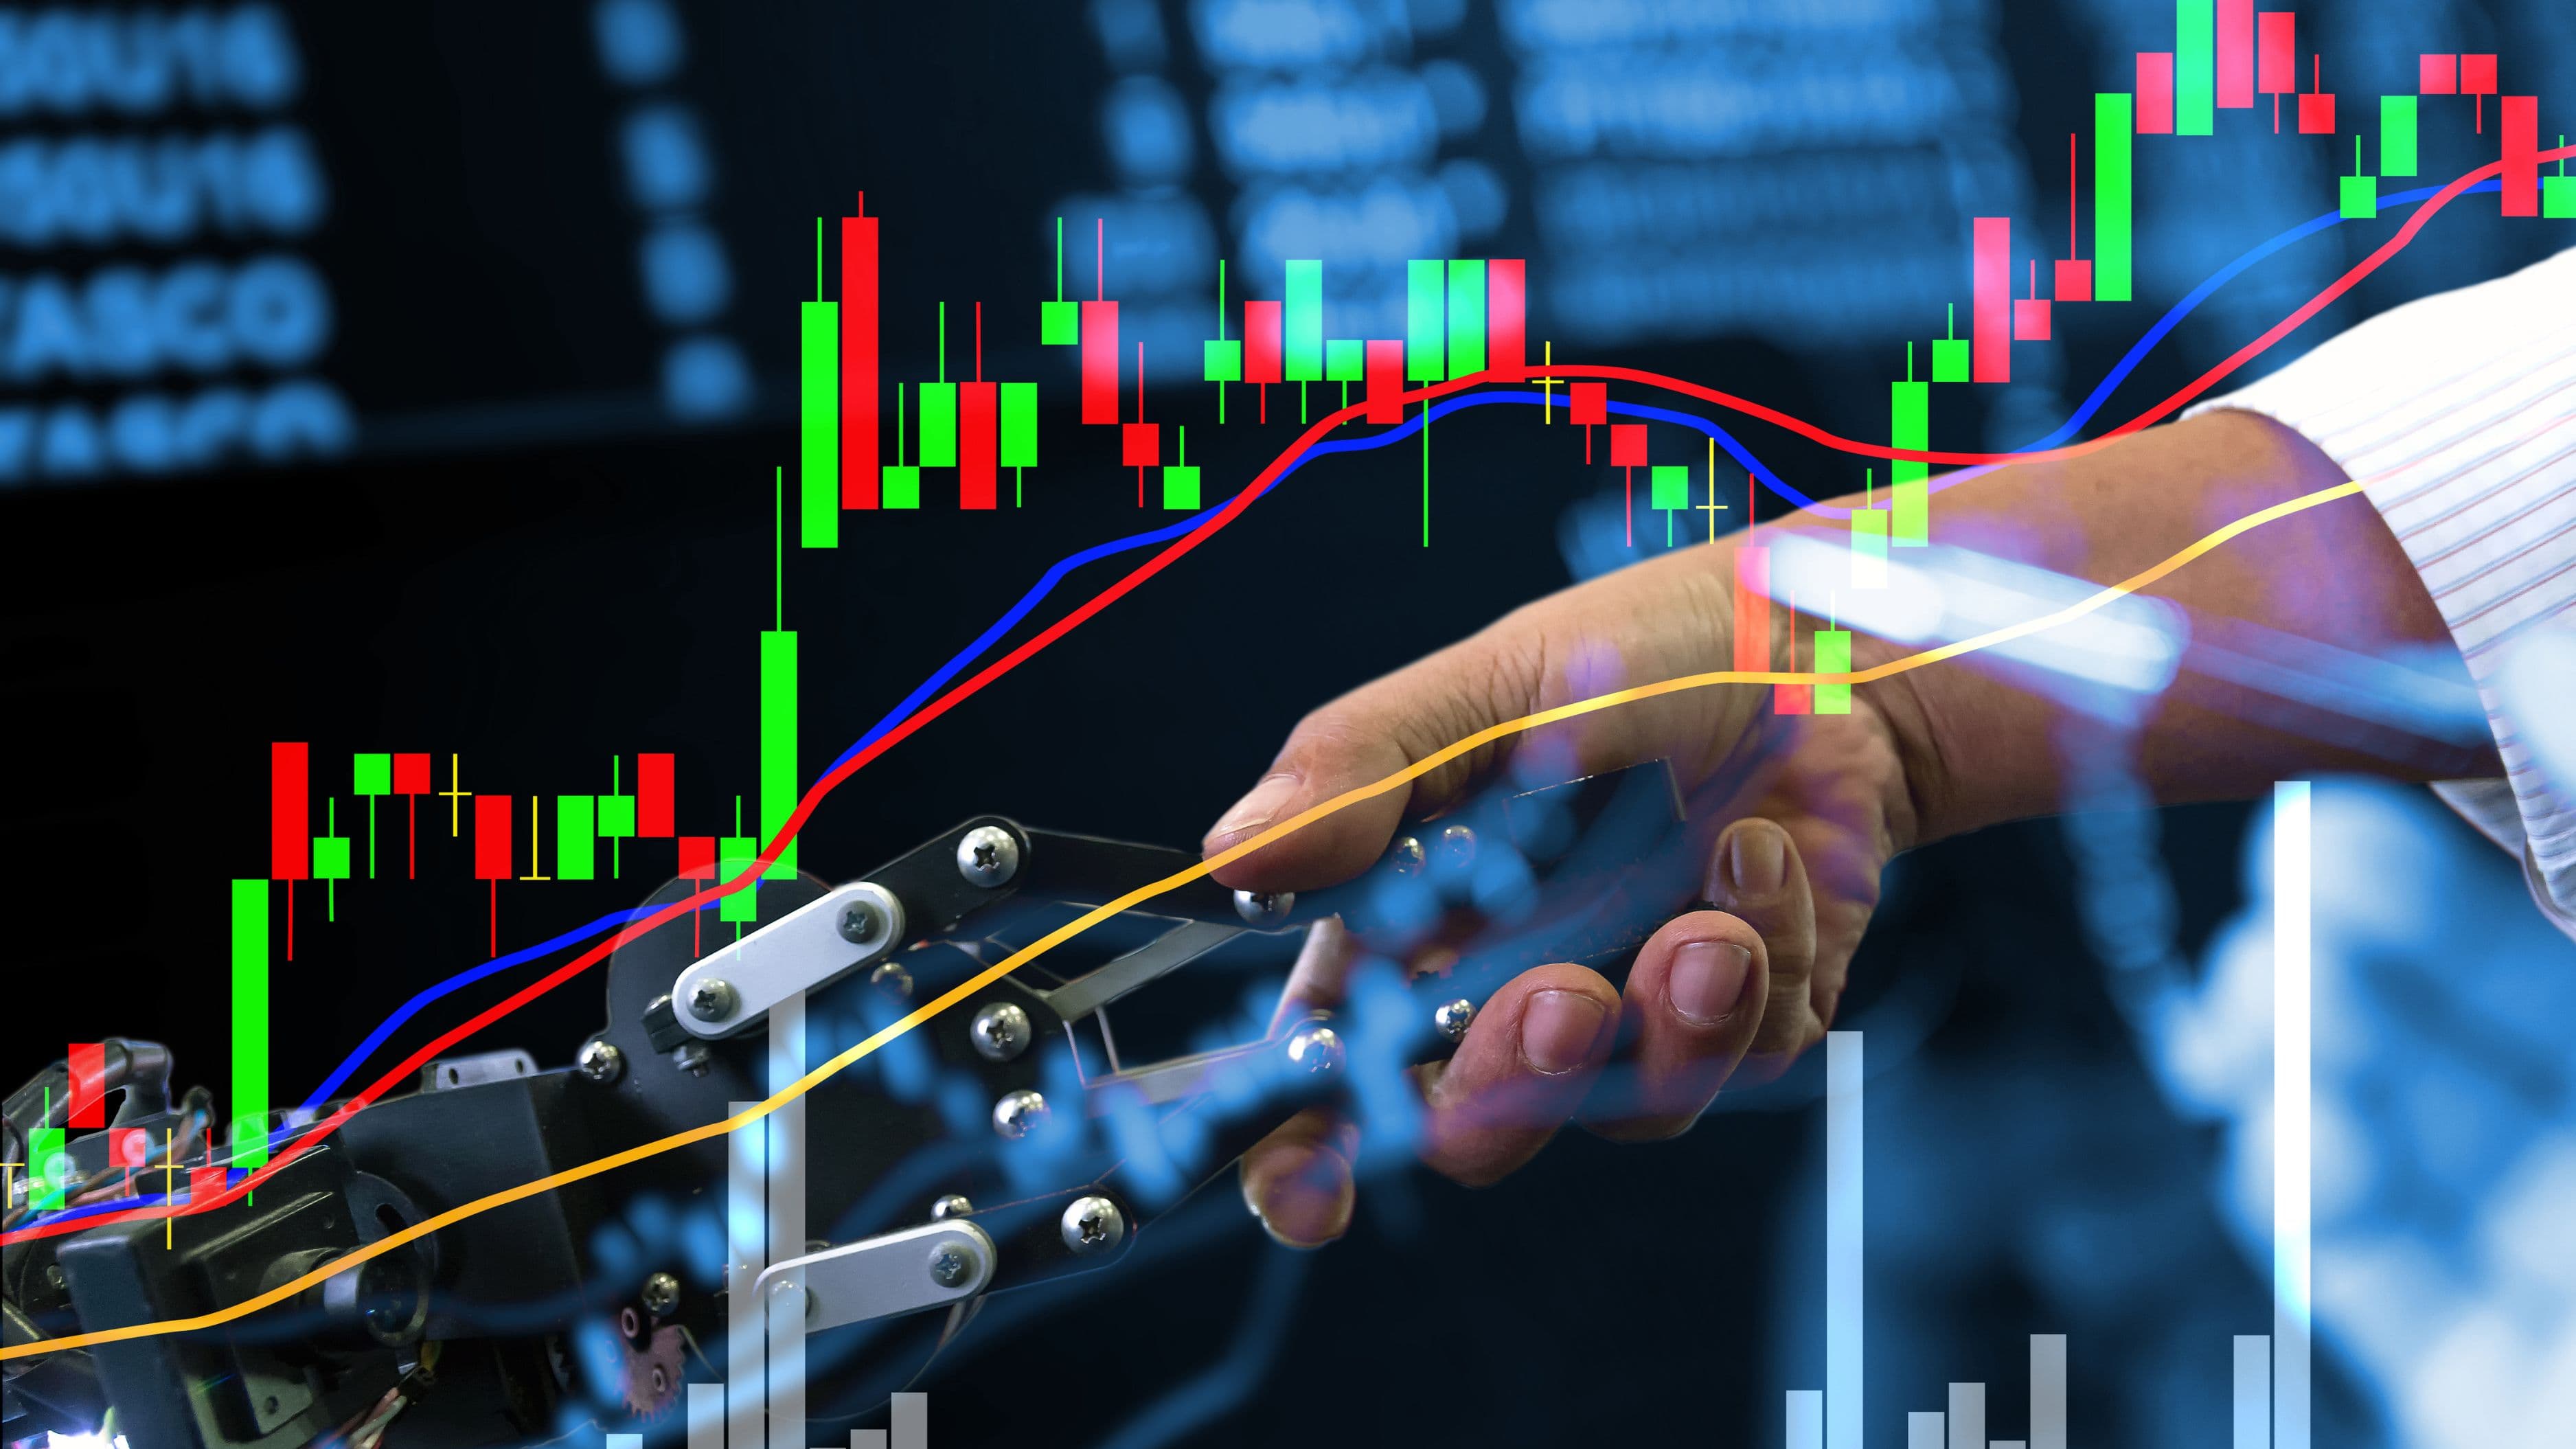
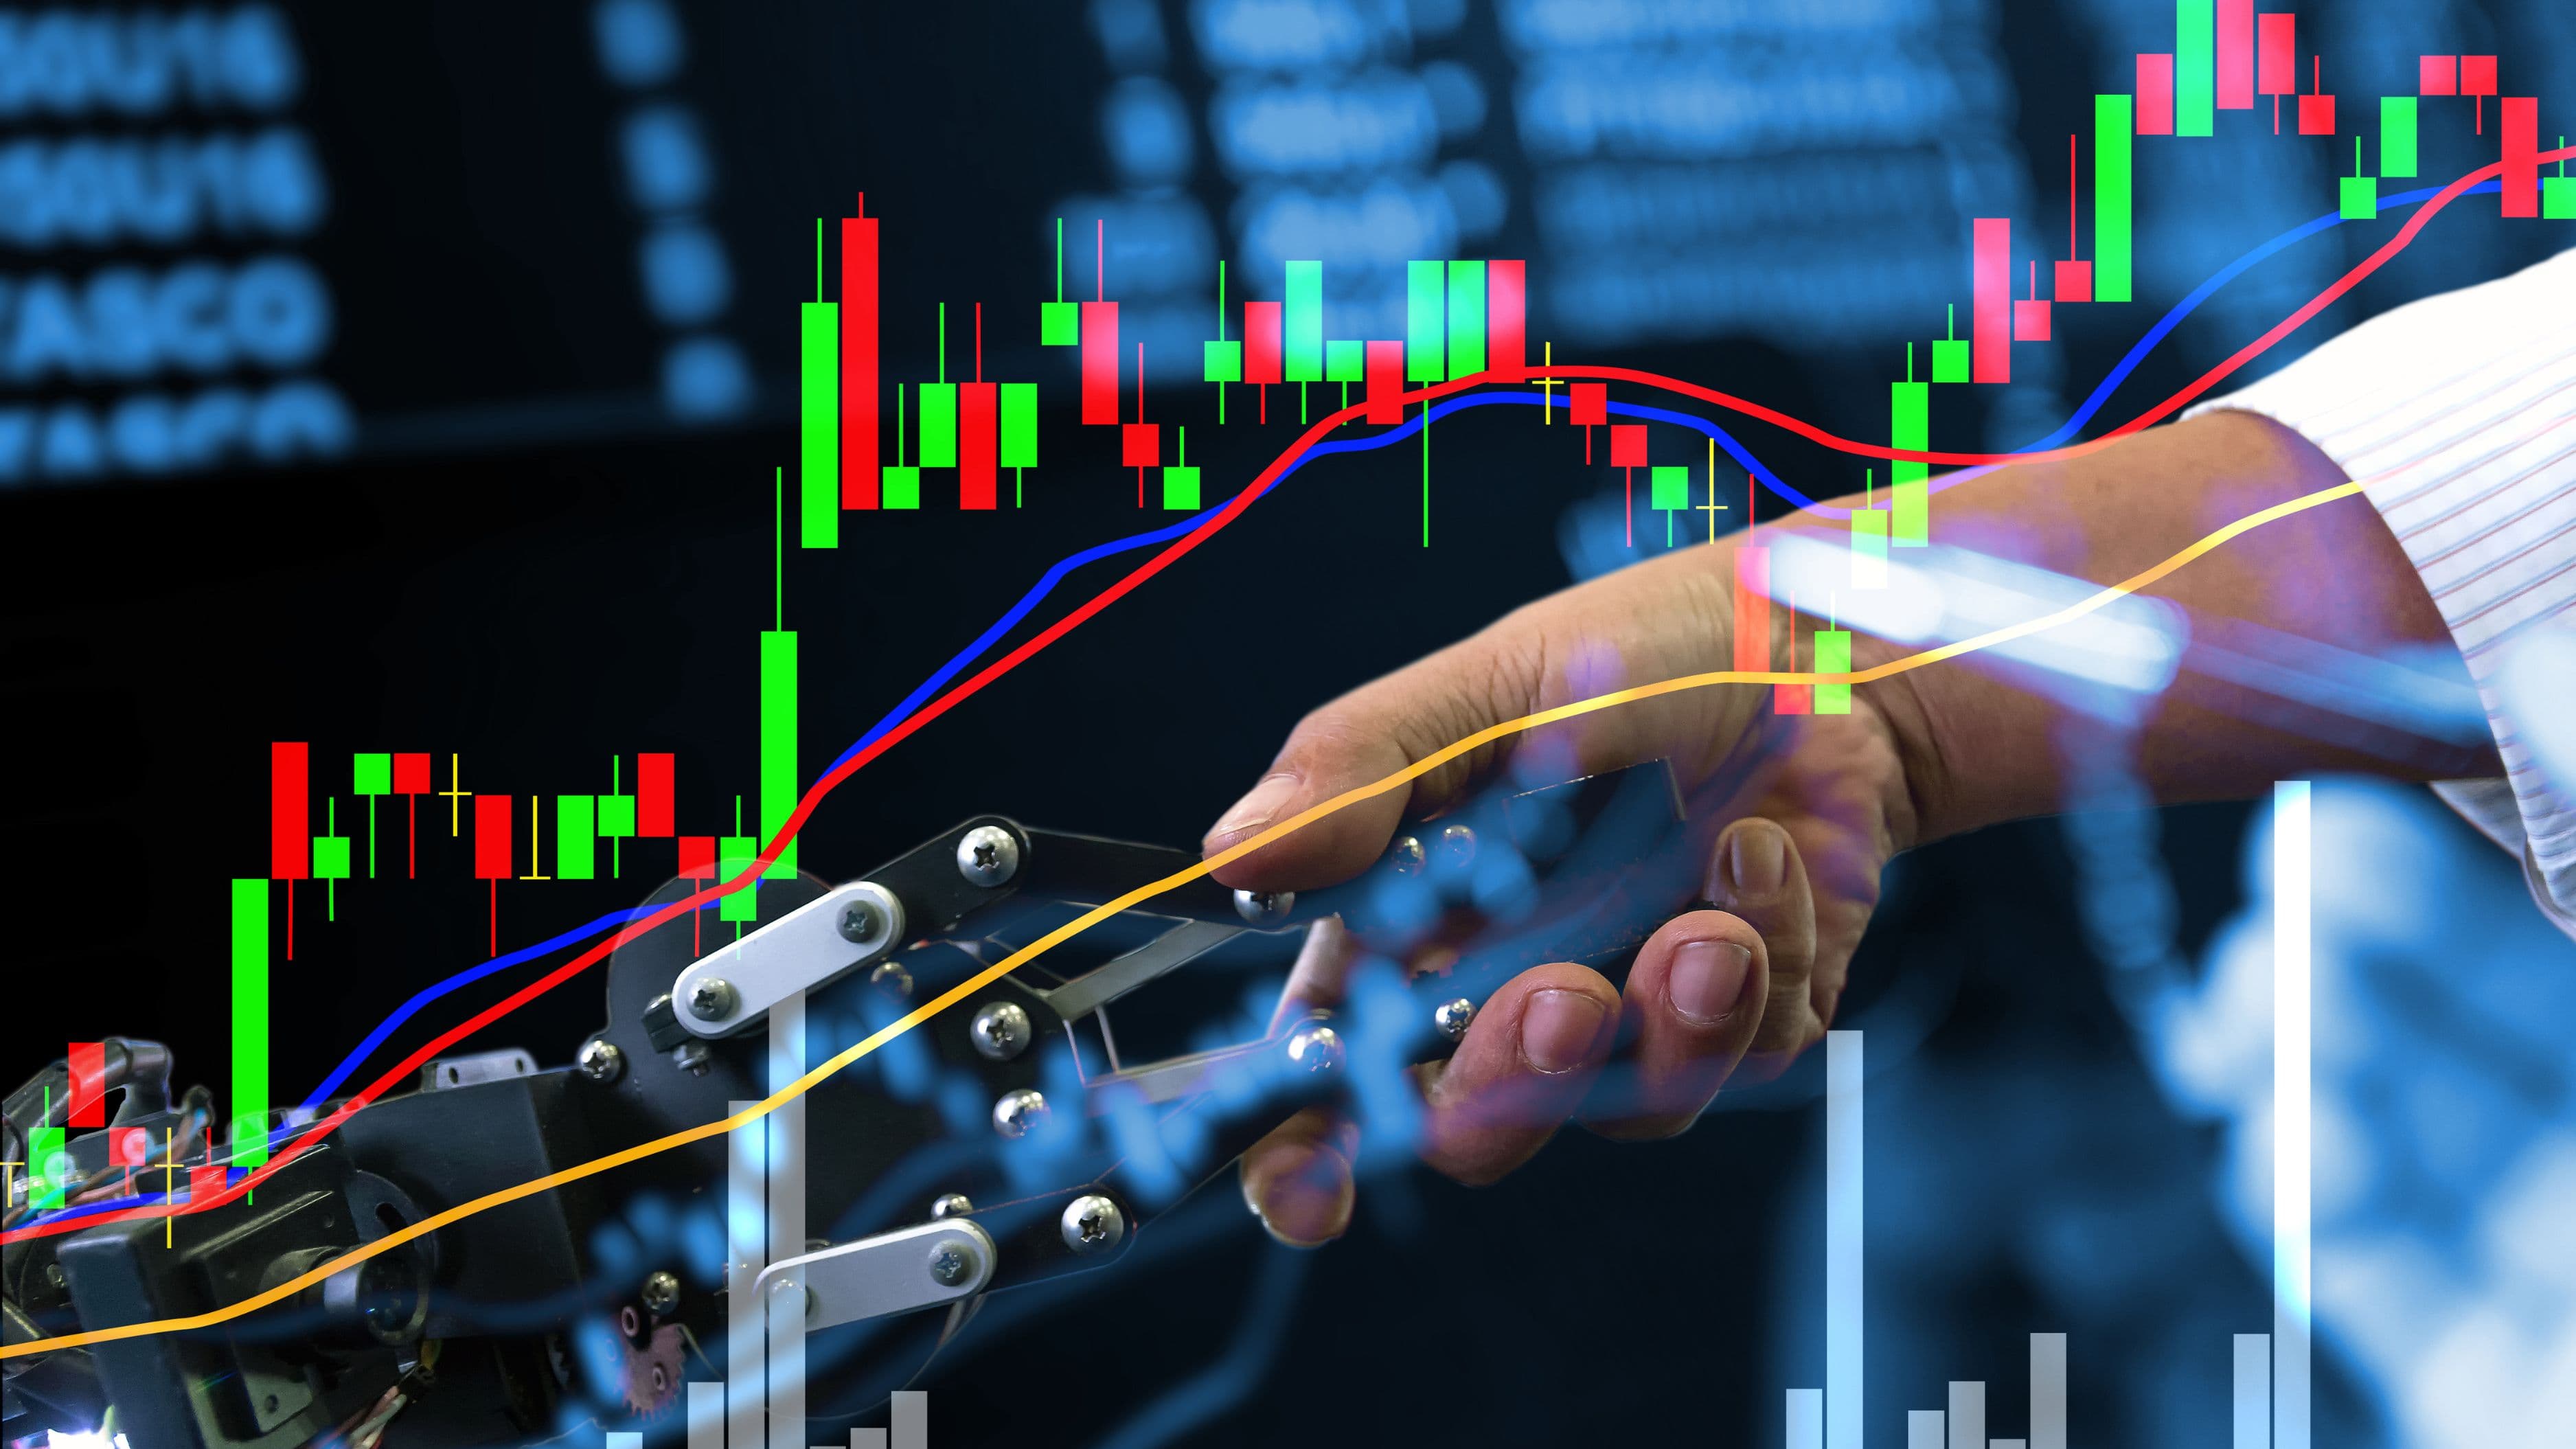
Some AI approaches also use neural networks capable of identifying complex, non-linear relationships in the data that don't fit neatly into the more rigid mathematical assumptions of traditional models, which can improve forecasting accuracy in situations where market behavior deviates from historical statistical patterns.
Real-World Example: How This Shows Up in Practice
Many retail investing platforms now use AI-driven volatility forecasting behind the scenes to power features like dynamic risk scoring, where a portfolio's stated risk level might adjust automatically based on current market conditions rather than remaining static. Some options trading platforms also incorporate AI-adjusted implied volatility estimates into their pricing tools, aiming to reflect a more current and comprehensive volatility outlook than a purely historical calculation would provide.
Hedge funds and institutional investors have used AI-driven volatility models for years to inform position sizing and risk limits, adjusting how much capital is allocated to a given trade based on the model's current volatility estimate for that asset, a practice that's gradually filtered down into more accessible retail investing tools as the underlying technology has become more efficient and affordable to deploy.
Benefits of the AI Approach
AI-driven models can process a significantly larger and more diverse set of data inputs than traditional statistical approaches, potentially capturing early signals of shifting volatility that purely historical price-based models might miss. They can also adapt more readily to changing market conditions over time, since machine learning models can be retrained on more recent data, whereas some traditional statistical models rely on fixed mathematical assumptions that may not hold as well during unusual market environments.
Risks and Limitations to Understand
Despite the added sophistication, AI-driven volatility forecasts are still forecasts, not guarantees, and they can be wrong, sometimes significantly, particularly during genuinely unprecedented market events that don't resemble any pattern in the model's training data. The 2020 market volatility around the onset of the pandemic is a commonly cited example where many forecasting models, both traditional and AI-driven, significantly underestimated the speed and scale of the volatility spike that followed.
There's also a risk of overfitting, where a machine learning model becomes very good at explaining historical patterns in its training data but performs poorly on new, unseen market conditions, essentially having learned quirks of the past rather than generalizable patterns about how markets behave. This is a genuine, ongoing challenge in the field, and it's part of why even sophisticated AI-driven models are typically used alongside traditional statistical approaches and human judgment, rather than as a sole, standalone decision-making tool.
What to Avoid
Avoid treating any volatility forecast, AI-driven or otherwise, as a precise, guaranteed prediction of future market movement. These models provide probabilistic estimates based on available data and historical patterns, not certainties, and unprecedented events can and do exceed what any model anticipated. It's also worth being skeptical of investment products or platforms that market their "AI-powered" volatility forecasting as a way to reliably avoid all market risk, since no forecasting approach eliminates the fundamental uncertainty involved in investing.
FAQ
Can AI predict a market crash before it happens? AI models can sometimes identify elevated risk conditions or unusual patterns that precede periods of higher volatility, but reliably predicting the specific timing and severity of a market crash remains an unsolved and extremely difficult problem, even with advanced AI approaches.
Do I need to understand volatility forecasting to invest well? No. Most everyday investors benefit from these models indirectly, through the risk management tools built into retirement accounts, robo-advisors, and investment platforms, without needing to understand the underlying forecasting methodology themselves.
Is AI-based volatility forecasting more accurate than traditional statistical models? In many studies, AI-driven models have shown improved accuracy over purely traditional statistical approaches, particularly when incorporating diverse data sources, though the improvement varies by asset class and market condition, and traditional models remain a widely used and reliable baseline.
📚 Sources
Federal Reserve Bank of San Francisco – Understanding Market Volatility – https://www.frbsf.org/research-and-insights/publications/economic-letter/
U.S. Securities and Exchange Commission – Investor Bulletin on Volatility – https://www.investor.gov/introduction-investing/general-resources/news-alerts/alerts-bulletins